Quarto
Day 1, Session 3

Agenda
- What is Quarto?
- Why use Quarto?
- The 3 essential ingredients
- Text
- Code
- Metadata
1.
What is Quarto?
What is Quarto?
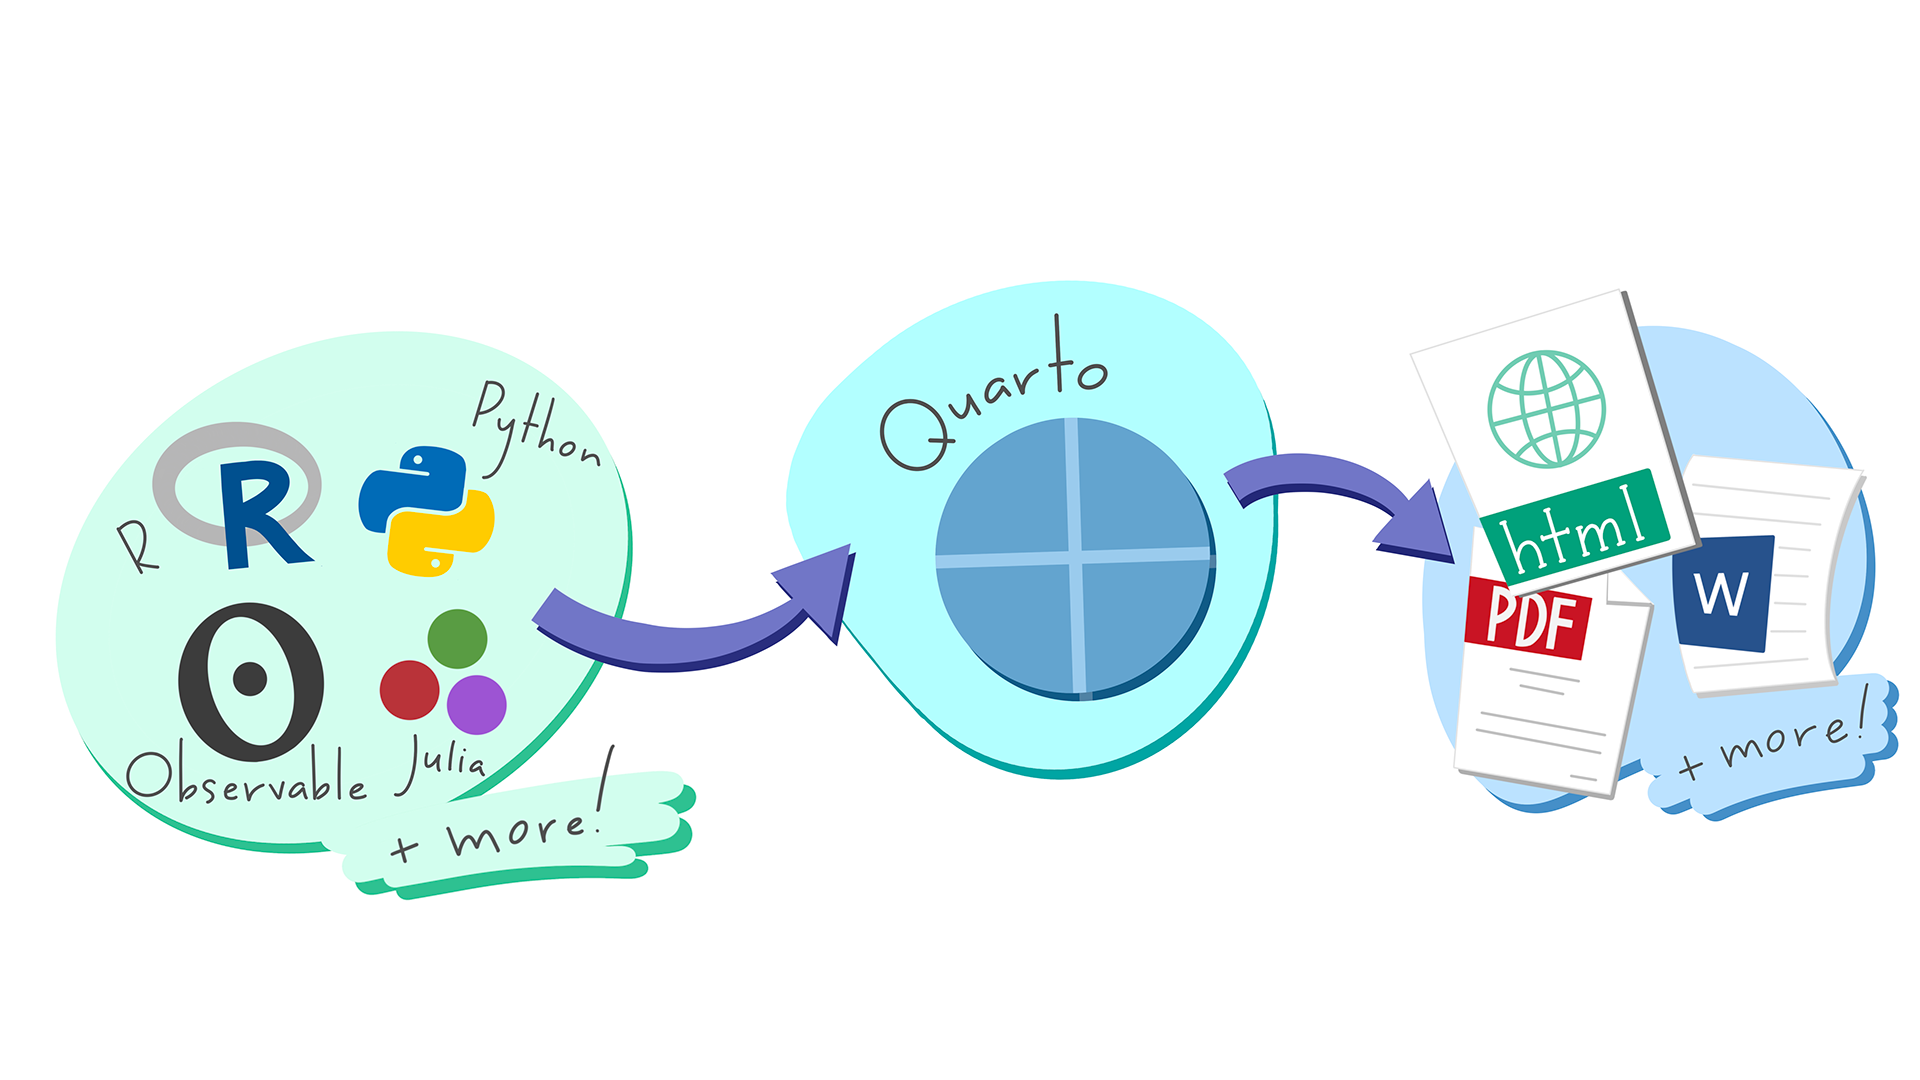
✍️ An authoring framework for data science
What is Quarto?
✍️ An authoring framework for data science
💾 A file format (.qmd)
What is Quarto?
✍️ An authoring framework for data science
💾 A file format (.qmd)
What is Quarto?
✍️ An authoring framework for data science
💾 A file format (.qmd)
📦 An R package (quarto)
What is Quarto?
✍️ An authoring framework for data science
💾 A file format (.qmd)
📦 An R package (quarto)
🛠 A tool for integrating prose, code, and output
What is Quarto?
✍️ An authoring framework for data science
💾 A file format (.qmd)
📦 An R package (quarto)
🛠 A tool for integrating prose, code, and output
✨ Magic
What's in a .qmd?
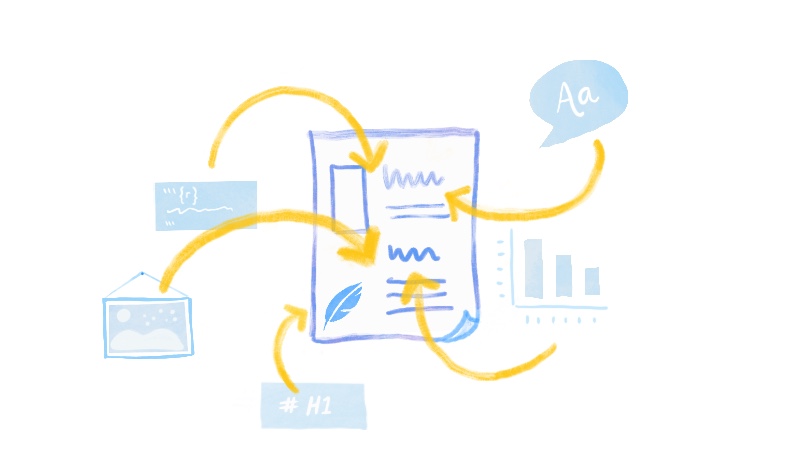
📃 Text and headers
💻 Code (R, Python, and more)
📊 Output (e.g. plots, tables, model results)
🖼 Images
... and more!
2.
Why use Quarto?
Replication crisis
These are just a few headlines from the past or so that highlight an ongoing problem across many fields of science -- that many published studies fail to replicate.
I won't go into details here, but suffice it to say, to solve the reproducibility crisis, we need both cultural changes in how science is conducted AND technological solutions.
Quarto gives us just that -- a technological solution for reproducibility.
To put this in perspective, I'm going to borrow one of my favorite historical analogies; we can think of Quarto like the advent of the printing press in the 15th century.
The printing press made it possible to reproduce any book AND, more importantly, make that process AUTOMATABLE. This revolutionary technology allowed the dissemination of information to the masses, which had a wide-ranging impact on society at large
Quarto does something similar for data science today -- you can share your Quarto document with someone else, and that person will have everything they need to reproduce your analysis AUTOMATICALLY, with the click of a button.
Because this process can be entirely automated, this has huge potential in a business setting to increase the efficiency of data science workflows, which in turn can lead to better business outcomes
3.
The 3 essential ingredients
The 3 essential ingredients
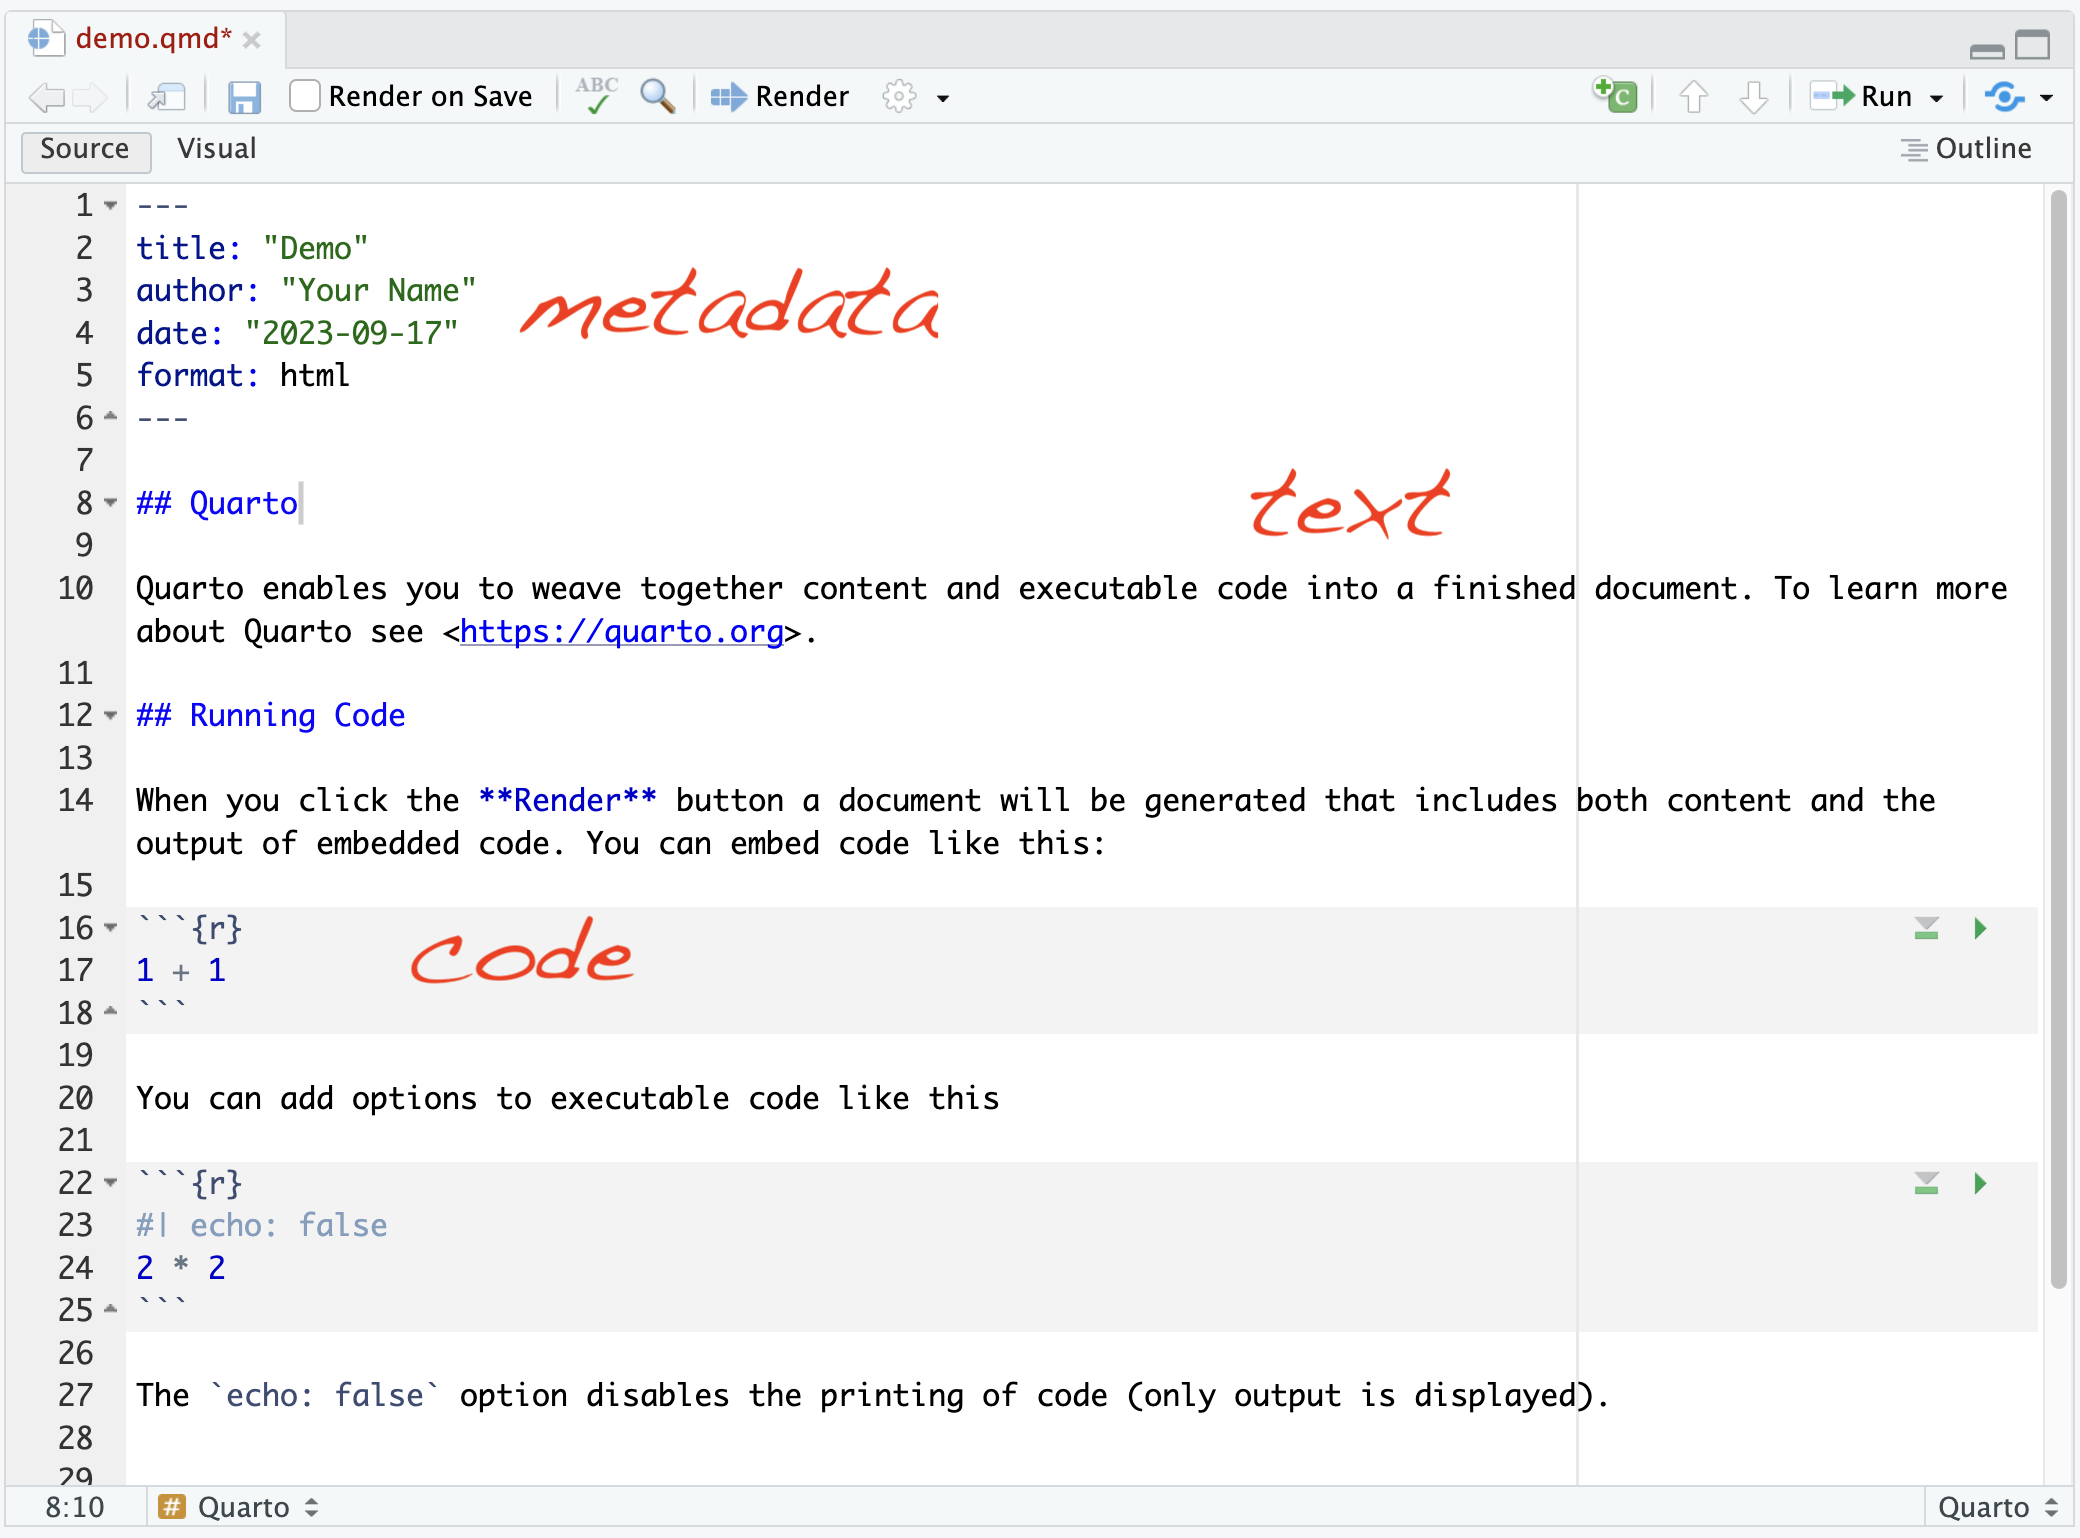
1. Text
2. Code
3. Metadata
The 3 essential frameworks
1. Text → Markdown
2. Code → knitr
3. Metadata → YAML

How does this all come together? Rendering!
Render

When you render the document...
Quarto sends the .qmd file to knitr, runs all the code and embeds results and text into an .md file.
Pandoc then converts the .md file into your chosen output format, which you specify using YAML metadata.
Render
Roadmap
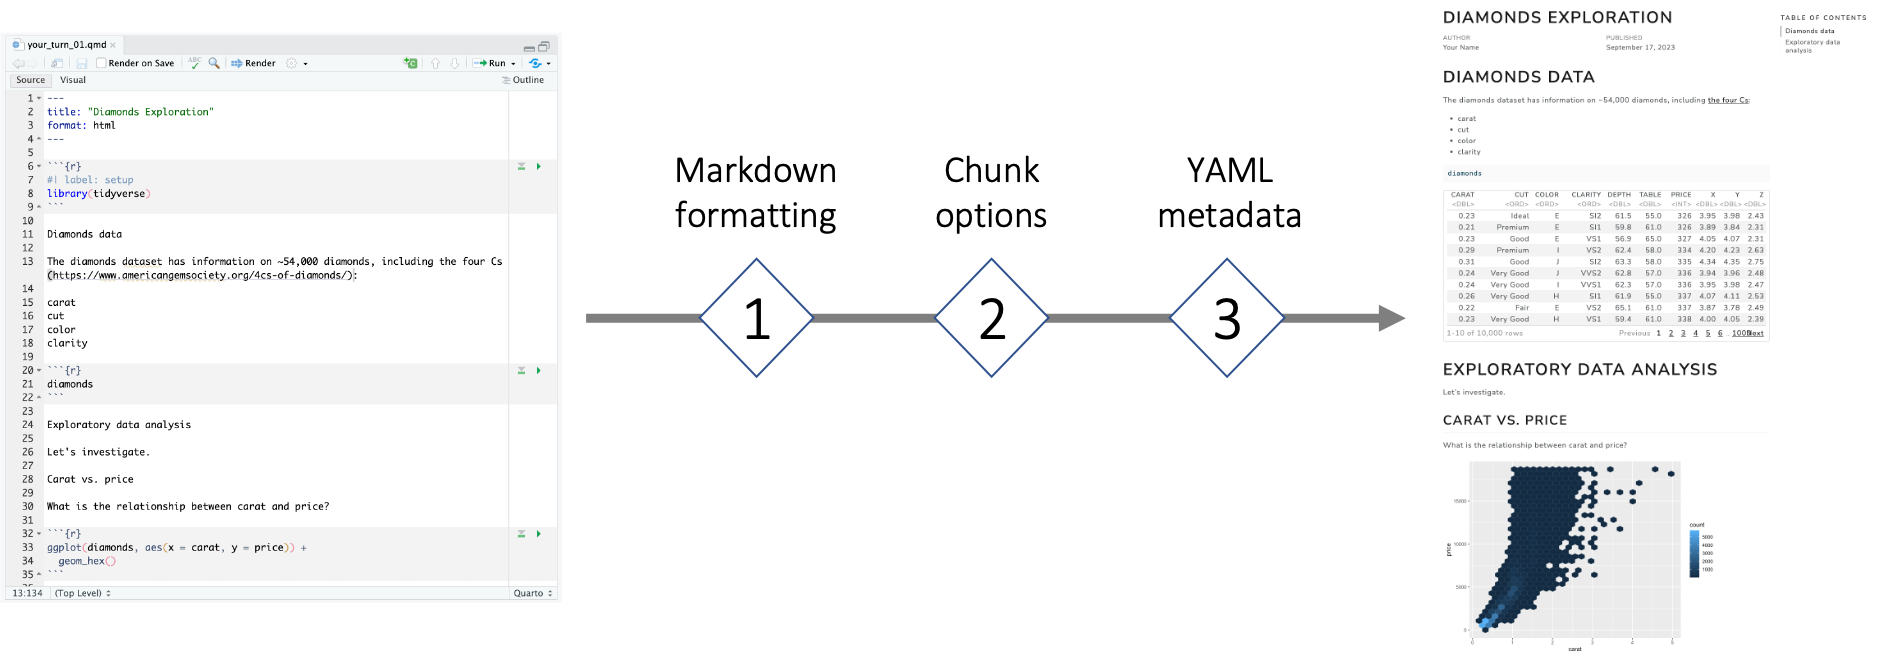
Text
Markdown
Text
What you type in .qmd 👇
Regular text*italics***bold** `verbatim code` > BlockquoteRendered output 👇
Regular text
italics
bold
verbatim code
Blockquote
I will go through this information quickly. Don't worry about absorbing all of this detail now. Have your cheatsheet handy for the exercises.
Headers
# Header 1## Header 2### Header 3#### Header 4##### Header 5###### Header 6Header 1
Header 2
Header 3
Header 4
Header 5
Header 6
Images

Images

Images
{width=50%}
Callouts
::: {.callout-note}A special note about the data.:::
ℹ️ Five types of callouts, including:
note, warning, important, tip, and caution.
Your Turn 1 (with a partner!)
📁 Open
your_turn_01.qmd.🔍 Inspect the contents of this HTML output.
💻 Add markdown formatting to
your_turn_01.qmdto re-create the HTML output.Render
your_turn_01.qmdto check your work.
Add Level-1 and Level-2 headers
Add a bulleted list
Add a hyperlink
Add an image (saved in the
images/directory)Add italicized and bolded text
05:00
Code
knitr
Chunk options
By default, code and output are both displayed.
Input
```{r}ggplot(mpg, aes(displ, hwy)) + geom_point()```Output
ggplot(mpg, aes(displ, hwy)) + geom_point()
Chunk options
Chunk output can be customized with options, which are specified using the "hashpipe":
#|
echo
echo: FALSE hides the code. Especially useful for plots!
Input
```{r}#| echo: falseggplot(mpg, aes(displ, hwy)) + geom_point()```Output

eval
eval: FALSE prevents the code from being run.
Input
```{r}#| eval: falseggplot(mpg, aes(displ, hwy)) + geom_point()```Output
ggplot(mpg, aes(displ, hwy)) + geom_point()include
include: FALSE runs the code, but prevents both the code and the output from appearing. Especially useful for setup chunks.
Input
```{r}#| include: falseggplot(mpg, aes(displ, hwy)) + geom_point()```Output
[no code or output shown]
warning
Some code will return a warning message along with the output.
Input
```{r}#| echo: falseggplot(airquality, aes(Temp, Ozone)) + geom_point()```Output
## Warning: Removed 37 rows containing missing values (`geom_point()`).
warning
warning: false will suppress warning messages in the output.
Input
```{r}#| echo: false#| warning: falseggplot(airquality, aes(Temp, Ozone)) + geom_point()```Output

Chunk labels
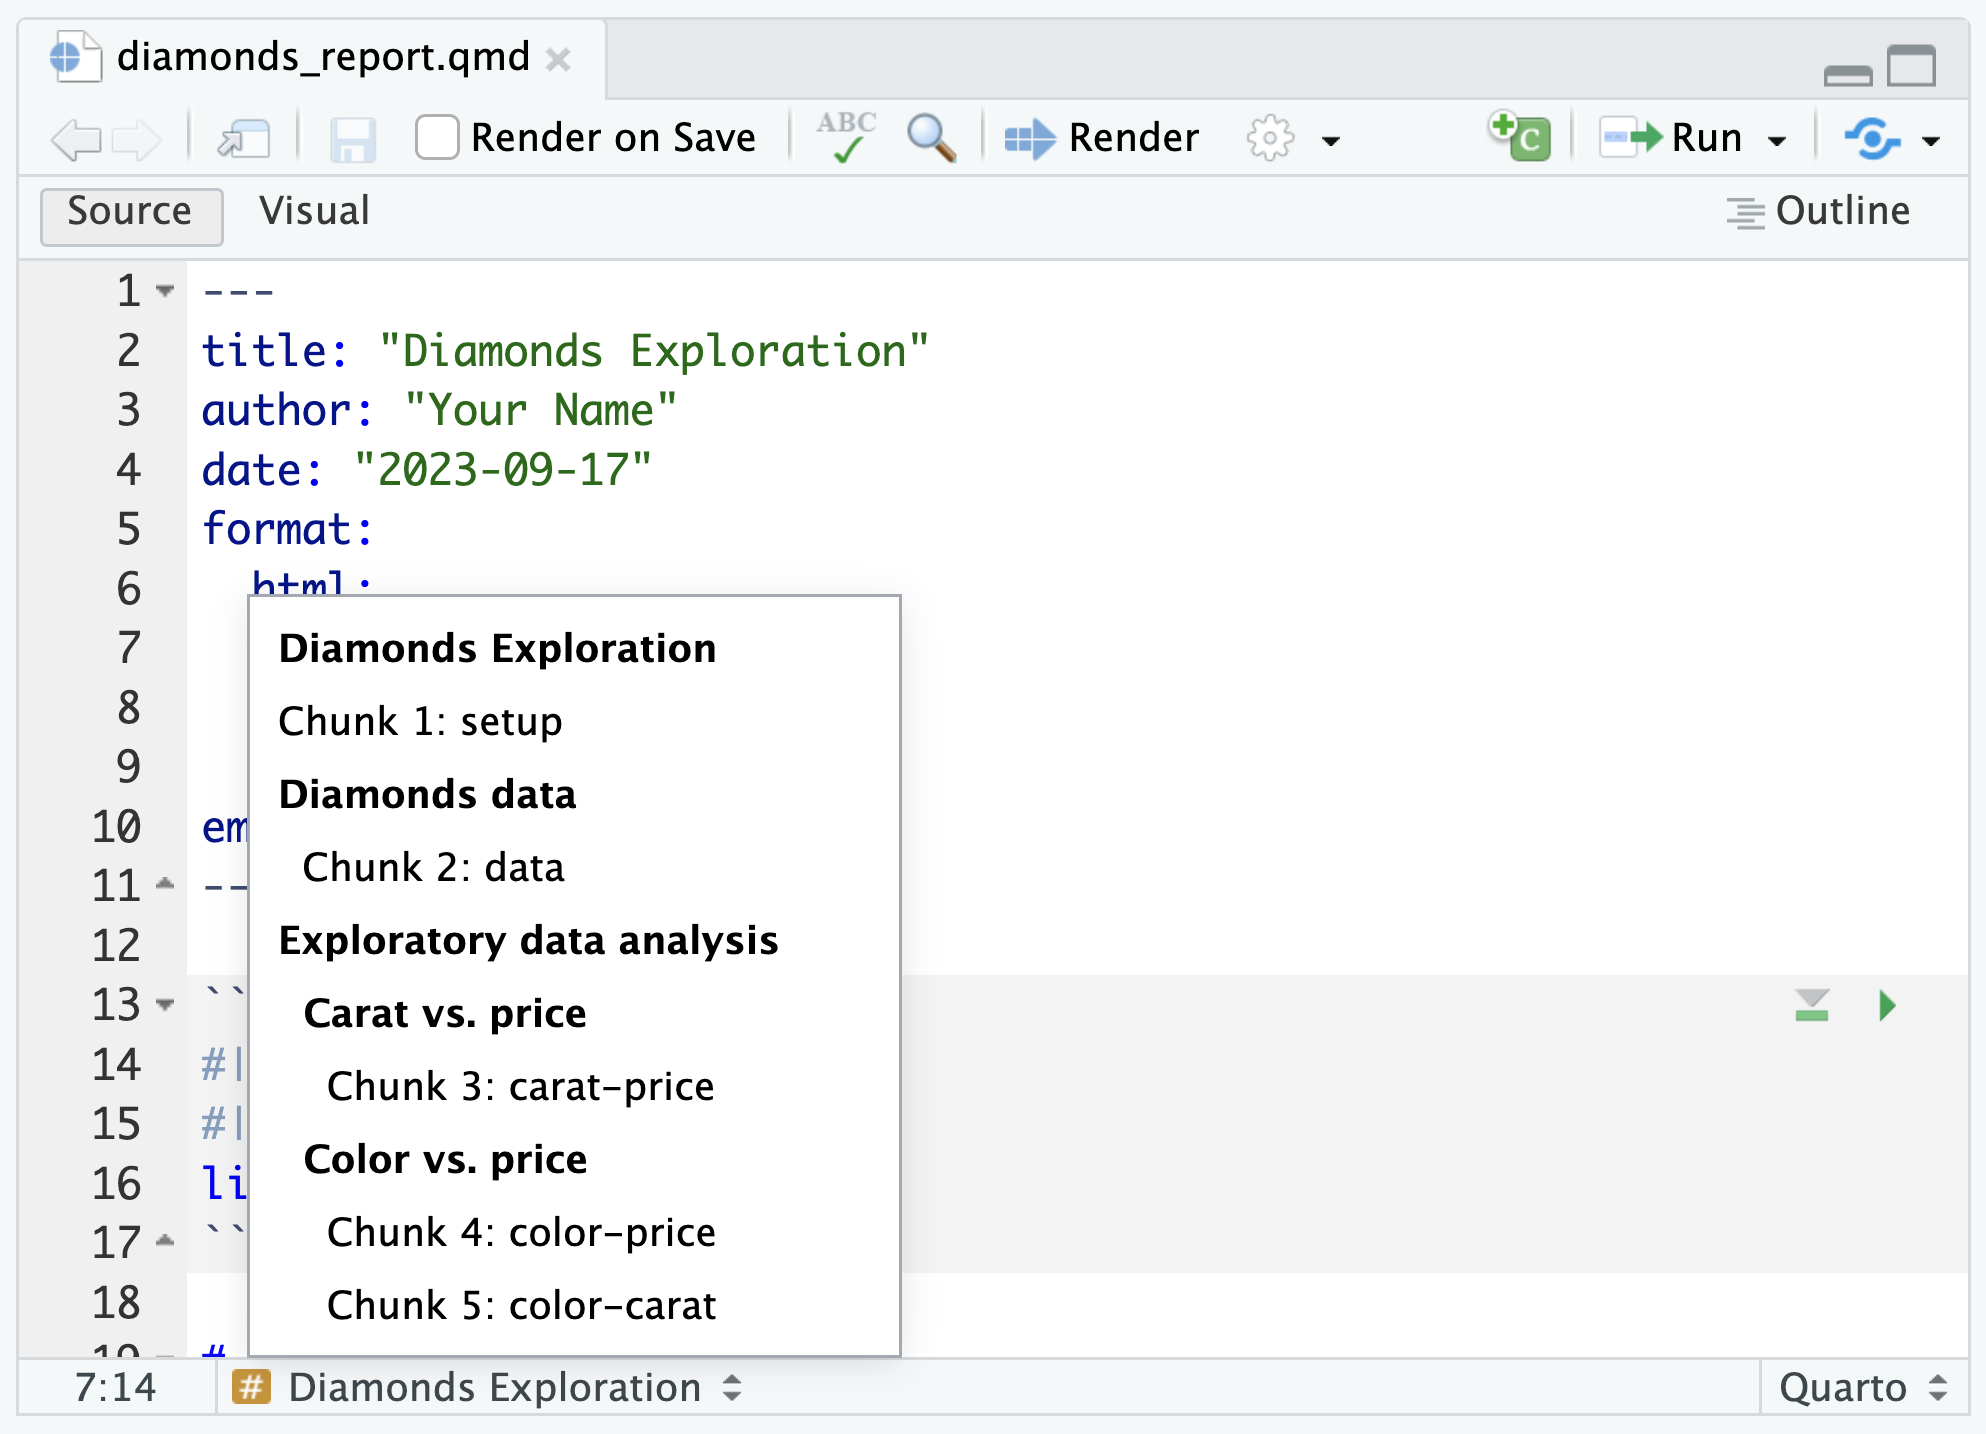
Use label to give chunks a descriptive summary.
```{r}#| label: peekglimpse(mpg)```Chunk labels
Use label to give chunks a descriptive summary.
```{r}#| label: peekglimpse(mpg)``````{r}#| label: peekhead(mpg)```Error in parse_block(g[-1], g[1], params.src) : duplicate label 'peek'Calls: <Anonymous> ... process_file -> split_file -> lapply -> FUN -> parse_blockExecution halted⚠️ Careful! No duplicate chunk labels
how can we make it easier on ourselves to explore the code in here?
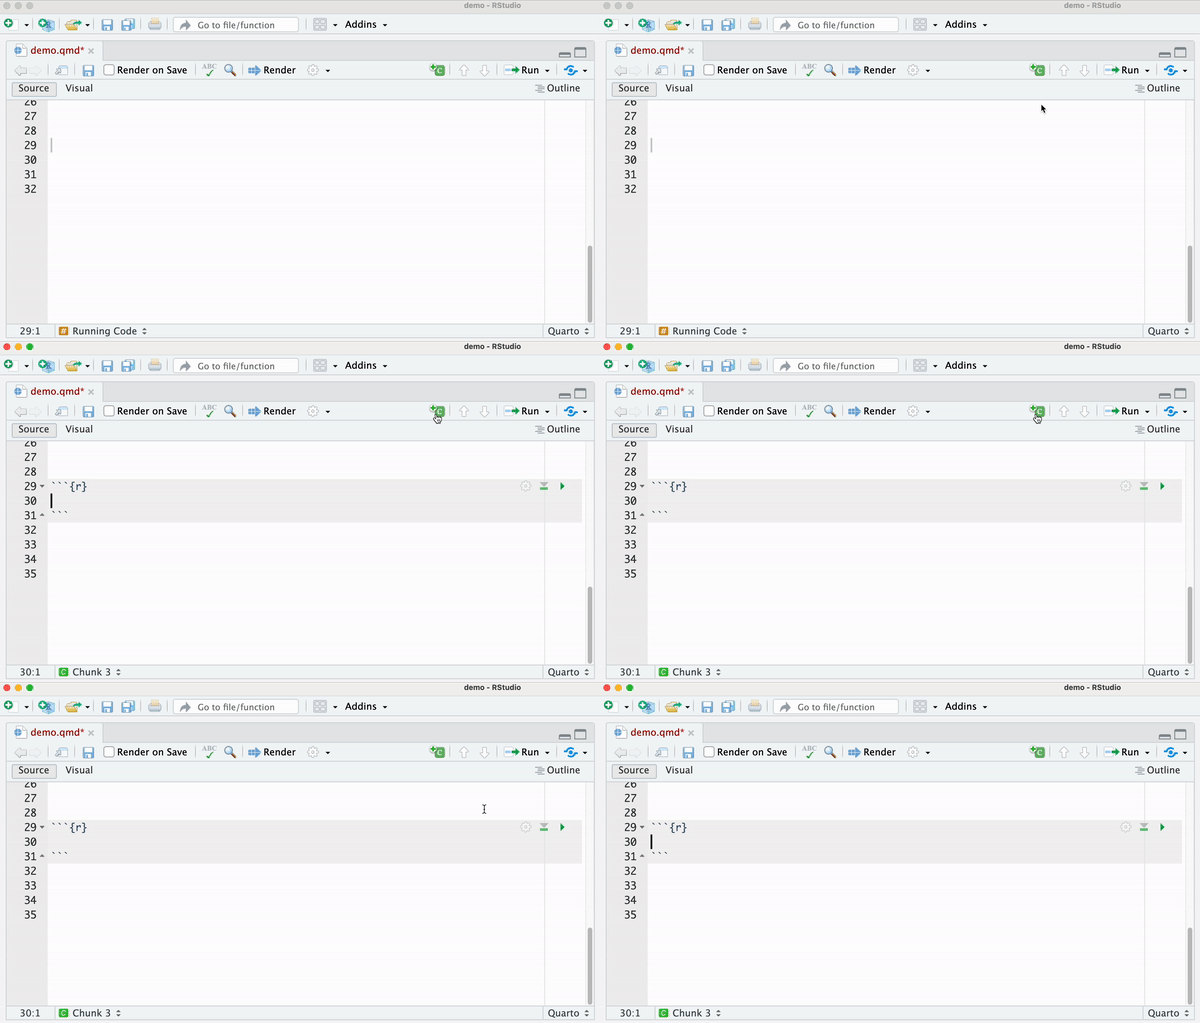
show how to add chunk labels and view in IDE interactively
Chunk labels
💡 Think "kebabs, not snakes"
Good
my-plot
myplot
myplot1
MY-PLOT
Bad
my_plot
my plot
...everything else!
Chunk labels
Easier to organize and navigate your document
Inline code
To include executable code within markdown text, enclose your code in r surrounded by single backticks.
Input
Our data includes measurements from `r n_distinct(mpg$model)` different car models.Output
Our data includes measurements from 38 different car models.
Your Turn 2
📁 Open
your_turn_02.qmd.🔍 Inspect the contents of this HTML output.
💻 Add chunk options to
your_turn_02.qmdto re-create the HTML output.Render
your_turn_02.qmdto check your work.
Hide the code and output of the setup chunk
Hide the code for all plots
Bonus: Add descriptive labels to your code chunks
05:00
Metadata
YAML
YAML
A section of key: value pairs separated by dashes ---
---key: value---YAML
---title: Diamonds Explorationauthor: Brendan Cullenformat: html---YAML
---title: Diamonds Explorationauthor: Brendan Cullenformat: html------title: Diamonds Explorationauthor: Brendan Cullenformat: html: toc: true---Add a table of contents
YAML
---title: Diamonds Explorationauthor: Brendan Cullenformat: html------title: Diamonds Explorationauthor: Brendan Cullenformat: html: toc: true toc-depth: 3---Add a table of contents
...with 3 levels
YAML - indentation matters!
YAML - indentation matters!
---title: Diamonds Explorationauthor: Brendan Cullenformat:html:toc: truetoc-depth: 3---❌
YAML - indentation matters!
---title: Diamonds Explorationauthor: Brendan Cullenformat:html:toc: truetoc-depth: 3---❌
---title: Diamonds Explorationauthor: Brendan Cullenformat: html: toc: true toc-depth: 3---✅
Indent format 2 characters
Indent options 4 characters
Your Turn 3
📁 Open
your_turn_03.qmd.🔍 Inspect the contents of this HTML output.
💻 Add YAML metadata to
your_turn_03.qmdto re-create the HTML output.Render
your_turn_03.qmdto check your work.
Add your name as the author
Add today's date
Add a table of contents
Apply the
luxtheme to your documentPrint the
diamondsdataset as a paged table
05:00
Take-aways
Take-aways
✅ Document your document: use YAML to set up meaningful metadata
Take-aways
✅ Document your document: use YAML to set up meaningful metadata
✅ Style your document: use YAML to add options to your chosen output format
Take-aways
✅ Document your document: use YAML to set up meaningful metadata
✅ Style your document: use YAML to add options to your chosen output format
✅ Style your text: use markdown for bold, italics, code, bullets and lists
Take-aways
✅ Document your document: use YAML to set up meaningful metadata
✅ Style your document: use YAML to add options to your chosen output format
✅ Style your text: use markdown for bold, italics, code, bullets and lists
✅ Style your output: use chunk options (echo, eval, etc.)
Take-aways
✅ Document your document: use YAML to set up meaningful metadata
✅ Style your document: use YAML to add options to your chosen output format
✅ Style your text: use markdown for bold, italics, code, bullets and lists
✅ Style your output: use chunk options (echo, eval, etc.)
✅ Organize your text: use markdown headers with #
✅ Organize your code: use chunk labels
✅ Preview your work: render early, render often
